
In today’s fast-moving software landscape, DevOps monitoring has evolved from a nice-to-have into a non-negotiable practice. Whether you are building mobile applications, deploying AI agents, managing an ecommerce platform, or scaling IoT device fleets, your ability to observe, alert, and respond in real time determines whether your systems stay healthy or go dark at 3 AM.
This guide covers the top DevOps monitoring tools in use today, broken down by development domain. We sourced these picks from our DevOps engineers for hire who use them along with our internal tools for our clients.
This is what practitioners actually reach for.
Quick Comparison Table: DevOps Monitoring Tools at a Glance
Before diving deep, here is a high-level snapshot of the most widely used tools, their type, ideal use case, and pricing model.
| Tool | Type | Best For | Price Model | Open Source? |
| Prometheus + Grafana | Metrics & Dashboards | General DevOps, K8s, IoT, AI/ML | Free | Yes |
| Datadog | Full-stack SaaS APM | All domains – web, mobile, LLM, IoT | Paid (expensive) | No |
| New Relic | APM + RUM | Web apps, CMS, ecommerce, Salesforce | Freemium | No |
| ELK Stack | Log Analytics | Software dev, ecommerce, CMS | Free (self-hosted) | Yes |
| Sentry | Error Tracking | Mobile, web, CMS front/backend | Freemium | Partial |
| Firebase Crashlytics | Crash Reporting | Mobile (iOS/Android) | Free | No |
| Splunk | Log Management | Enterprise, Salesforce, ecommerce | Paid | No |
| Dynatrace | AI-powered APM | Ecommerce, large enterprises | Paid | No |
| Langfuse | LLM Observability | LLM, GenAI, RAG pipelines | Free / Cloud | Yes |
| Weights & Biases | MLOps Tracking | AI/ML model training & LLM | Freemium | No |
| MLflow | MLOps Platform | AI/ML experiment tracking | Free | Yes |
| AgentOps | Agent Monitoring | Agentic AI systems | Freemium | Partial |
| InfluxDB | Time-series DB | IoT sensor & device data | Freemium | Yes |
| OpenTelemetry | Instrumentation Standard | Microservices, LLMs, Agents | Free | Yes |
| LangSmith | LLM Debugging | LangChain/LangGraph agent dev | Freemium | No |
| Arize Phoenix | LLM Tracing | GenAI, agent span tracing | Free | Yes |
| Gearset | Salesforce DevOps | Salesforce pipelines & CI/CD | Paid | No |
| Jaeger | Distributed Tracing | Microservices, web APIs | Free | Yes |
What Is DevOps Monitoring?
At its core, monitoring in DevOps means continuously collecting, analyzing, and acting on data from your software systems, infrastructure, applications, logs, traces, and user experience. It is the practice that closes the loop between what your team deploys and how it actually performs in production. Every monitoring tool in DevOps serves this same fundamental goal: give your team the visibility they need to catch problems before users do.
Modern DevOps monitoring goes beyond simple uptime checks. It encompasses the full observability triad:
- Metrics – quantitative measurements (CPU, latency, error rates, token costs)
- Logs – timestamped records of system events and application behavior
- Traces – end-to-end request journeys across distributed services
The best devops monitoring tool for your team depends heavily on what you are building. A mobile app team cares about crash rates, while an LLM team cares about hallucination frequency and token spend. That is exactly why this guide organizes recommendations by domain.
What Is Continuous Monitoring in DevOps?
Continuous monitoring in DevOps is the practice of tracking system health, security posture, and application performance automatically and without interruption, from code commit all the way through to production.
DevOps automation services are the monitoring discipline that integrates tightly with CI/CD pipelines so that every release is immediately tracked.
Unlike scheduled checks or manual reviews, continuous monitoring of DevOps pipelines surfaces issues the moment they appear, whether that is a spike in API latency after a new deployment, a memory leak on a device fleet, or an unexpected increase in LLM API costs.
Key characteristics of a strong continuous monitoring setup:
- Automated alerting with intelligent noise reduction (not every spike is an incident)
- Integration with CI/CD so deployment events trigger immediate health checks
- Unified dashboards that give the whole team, not just ops, visibility into system state
- SLO/SLA tracking to measure reliability commitments over time
The continuous monitoring tools in DevOps that best support this workflow include Prometheus with alerting rules, Grafana for dashboards, PagerDuty for incident routing, and OpenTelemetry as the instrumentation backbone.
DevOps Expert India Approved Standard DevOps Monitoring Stack
My conversations with our DevOps development services team, who have worked on countless projects use a combination of open source and closed source DevOps monitoring tools.
Let’s quickly go through the list before we discuss them one by one in detail.
The Core Open-Source Stack
- Prometheus – metrics collection and alerting rules
- Grafana – visualization, dashboards, and on-call alerting
- Grafana Loki – log aggregation without the ELK overhead
- Grafana Tempo – distributed tracing
- OpenTelemetry – vendor-neutral instrumentation for code
- ELK Stack (Elasticsearch + Logstash + Kibana) – centralized log analytics at scale
- Jaeger / Zipkin – distributed request tracing for microservices
When Teams Go Paid
Professional teams like ours use a combination of both free and paid tools. These tools are perfect for speed and simplicity.
- Datadog – all-in-one SaaS APM with 600+ integrations; excellent Kubernetes support
- New Relic – strong APM, competitive pricing vs Datadog, good for mid-sized teams
- Dynatrace – AI-powered root cause analysis; preferred by large enterprises
- Splunk – the enterprise log management standard; heavy but powerful
- PagerDuty / OpsGenie – incident response and escalation routing
Top DevOps Monitoring Tools by Development Domain
Here is where the best monitoring tools for DevOps diverge based on what your team actually builds. No two domains have the same monitoring needs.
Mobile App Development (iOS, Android, React Native, Flutter)
Mobile monitoring is fundamentally different from server-side observability. You cannot SSH into a user’s device. The focus shifts from infrastructure metrics to crash analytics, ANR rates, and user session data.
- Firebase Crashlytics – Built for Apple, Android, Flutter, and Unity, Firebase Crashlytics is a free default for crash reporting on iOS and Android devices. It integrates natively with Google, Firebase, Jira, Slack, BigQuery, and other ecosystems.
- Sentry – It one of the top cross-platform error tracking app and our developers love its ability to link mobile crashes directly to backend service issues.
- Datadog RUM – If you want Real User Monitoring with session replay capability for identifying UX pain points then Datadog RUM.
- New Relic Mobile – New Relic offers DevOps capabilities for multiple platforms, but their app performance monitoring, crash analytics, and HTTP request tracking is on the class of their own.
- Instabug – Specifically designed for mobile, Instabug is an in-app bug reporting and performance monitoring.
Web and Software Development (APIs, Microservices, Backend Services)
Our site reliability engineering teams use the classic observability triad most closely: metrics from Prometheus, logs from ELK or Loki, and traces from Jaeger or OpenTelemetry.
- Prometheus + Grafana – When it comes to monitoring the metrics of your webpage or dashboards, Prometheus + Grafana is still the best combination to have.
- ELK / OpenSearch –When it comes to analyzing data from various sources, ELK is one of the most powerfuk tools. Similarly, OpenSearch is a great enterprise grade for centralized logging and full-text search across services.
- Sentry – front-end and back-end error tracking with JS, Python, Go, and Ruby SDKs
- Jaeger / OpenTelemetry – distributed tracing to follow a request across microservices
- Grafana Loki – lightweight log aggregation that pairs naturally with Grafana
- New Relic APM – request profiling, DB query analysis, and front-end monitoring
Ecommerce Development (Shopify, Magento, WooCommerce)
Ecommerce teams are acutely sensitive to performance because every millisecond of checkout latency can mean lost revenue. Monitoring here focuses on transaction tracing, uptime, and user experience, because a slow product page or a broken payment API does not just trigger an alert, it directly kills conversions.
- New Relic – New Relic is widely used in the Magento ecosystem for transaction tracing across checkout funnels. It lets teams pinpoint exactly which database query, third-party API call, or application bottleneck is adding latency to the most critical pages in your store.
- Datadog – For ecommerce platforms with complex infrastructure, Datadog provides end-to-end monitoring of order flows, payment API performance, inventory service health, and the underlying cloud infrastructure, all in a single unified view.
- Dynatrace – Dynatrace uses AI-powered dependency mapping to automatically discover every service and database your storefront depends on. It then correlates performance degradation directly to revenue impact, so teams know instantly whether a slowdown is affecting checkout volume.
- Elastic APM – Elastic APM combines the full-text search power of Elasticsearch with application performance monitoring, making it a strong fit for ecommerce teams that need to monitor both their product catalog search performance and the health of the order management services behind it.
- Sentry – For agencies managing multiple client storefronts, self-hosted Sentry is a favorite because it supports multi-project setups under one roof. It catches JavaScript errors on the storefront, PHP errors in the backend, and third-party integration failures across every client property.
- AWS CloudWatch + X-Ray – For storefronts hosted natively on AWS, CloudWatch handles infrastructure-level monitoring (Lambda, EC2, RDS), while X-Ray provides distributed request tracing, all without needing to integrate a third-party tool.
Salesforce Development (Apex, LWC, SFDC Pipelines)
Salesforce developers face a unique challenge: limited direct infrastructure access means they rely on external monitoring plus native Salesforce tooling to understand what is happening inside their org.
- Gearset – Gearset is the most-loved Salesforce DevOps tool across our teams. Beyond CI/CD and deployment management, it provides monitoring for deployment health, error tracking, and even Jira backfeed so failures surface automatically in your team’s issue tracker.
- Copado – Copado is a purpose-built Salesforce DevOps platform that gives teams full pipeline observability, from feature branches through user acceptance testing to production. It is the enterprise choice for Salesforce teams that need governance, traceability, and compliance alongside monitoring.
- Splunk + Datadog – Because Salesforce limits direct log access, many teams push their Event Monitoring data and Apex logs to Splunk or Datadog via middleware or custom integrations. This combination gives teams enterprise-grade log search and alerting on top of Salesforce’s native data.
- New Relic – New Relic is frequently used to monitor the backend APIs and connected services that Salesforce integrations depend on. If your Salesforce org calls an external REST API or middleware layer, New Relic gives you the APM visibility that Salesforce itself cannot.
- Nebula Logger + Pharos.ai – Nebula Logger is the open-source community standard for structured Apex logging inside Salesforce, while Pharos.ai adds exception notifications and LWC component error tracking with a free tier. Together, they are the go-to in-org observability stack our Salesforce engineers recommend internally.
- Salesforce Event Monitoring + Debug Logs – Native Salesforce tools for baseline audit trails and developer debugging. Event Monitoring captures user activity and API usage at the platform level, while Debug Logs let developers trace Apex execution line by line.
CMS Development (WordPress, Drupal, Contentful, Strapi)
CMS monitoring focuses on the issues that actually bring down content sites: slow database queries, plugin conflicts, caching layer failures, and hosting-level resource exhaustion. Unlike application monitoring, the biggest threats here are often invisible until a page grinds to a halt.
- New Relic – New Relic is the explicit favorite among our CMS engineers for WordPress and Drupal APM. It integrates at the PHP level to surface slow database queries, plugin-generated overhead, and external API call latency, giving CMS developers the visibility they need to optimize performance without digging through raw server logs.
- Prometheus + Grafana – For teams running Drupal or WordPress on Kubernetes or self-managed infrastructure, Prometheus + Grafana is the standard stack for monitoring PHP-FPM workers, MySQL or MariaDB query performance, Nginx connections, and Varnish cache hit rates, all in a unified dashboard.
- Datadog – For larger CMS deployments at scale, Datadog provides infrastructure and APM monitoring across the full stack. It connects web server metrics, application performance data, and database health into one platform, useful for agencies or media companies managing high-traffic content properties.
- Sentry – Sentry handles error tracking for both PHP and Node.js CMS backends as well as JavaScript front-ends. When a WordPress plugin throws a PHP exception or a Strapi API route returns a 500, Sentry captures the full context and notifies the right team member immediately.
- Query Monitor (WordPress) – Query Monitor is a free WordPress plugin that surfaces database queries, hooks, API calls, and conditional tags directly inside the WordPress admin dashboard. It is the first tool most of our WordPress developers install when hunting for the query that is killing page load time.
- Elastic APM – For teams already running the ELK stack for log management, Elastic APM adds application performance monitoring for Drupal and WordPress backends, correlating slow application traces directly with the log events that preceded them.
IoT Development (Edge Devices, Embedded Systems, MQTT)
IoT monitoring is defined by scale and time-series data. You may be monitoring thousands of devices simultaneously, each streaming sensor readings every few seconds. Traditional application monitoring tools were not built for this, which is why the IoT domain has its own specialized stack.
- InfluxDB – InfluxDB is the purpose-built time-series database for IoT sensor and telemetry data. Unlike relational databases, InfluxDB is optimized for high write throughput and time-range queries, exactly the access patterns you have when ingesting millions of temperature readings, vibration signals, or GPS coordinates per minute.
- Prometheus + Grafana – For IoT device fleets where devices expose a metrics endpoint, Prometheus scales to millions of data points and Grafana turns that raw telemetry into real-time fleet health dashboards. This is the standard combination for teams running IoT gateways on Linux.
- Telegraf – Telegraf is InfluxData’s open-source metrics collection agent that runs on edge devices or gateways. It collects device-level metrics including CPU, memory, disk, network, and MQTT messages, and ships them to InfluxDB or Prometheus without requiring custom code.
- Zabbix – For large device fleets, Zabbix provides auto-discovery so new devices register automatically as they come online, plus threshold-based alerting that fires when a sensor reading goes out of range or a device stops reporting altogether.
- AWS IoT Device Defender – For teams running their IoT backend on AWS, Device Defender provides security-focused monitoring: it audits device configurations for vulnerabilities, detects behavioral anomalies, and alerts when a device starts behaving in ways that suggest compromise or failure.
- ThingsBoard – ThingsBoard is an open-source IoT platform that handles device connectivity, data visualization, and rule-based alerting in one tool. It is particularly popular for teams that want to expose monitoring dashboards to customers or field technicians without building a custom front-end.
AI and ML Development (Model Training, Inference, MLOps)
AI and ML teams need to monitor not just infrastructure but model behavior, including drift, accuracy degradation, and training throughput. A GPU cluster can be perfectly healthy while the model it is serving silently degrades in quality. The best MLOps monitoring stacks catch both.
- Weights & Biases (W&B) – Weights & Biases is the experiment tracking and model monitoring platform most commonly used by our research and production ML teams alike. It logs training metrics, system resource utilization, model artifacts, and evaluation results in real time, and lets teams compare runs side by side to understand what actually improved model performance.
- MLflow – MLflow is the open-source MLOps platform that covers the full model lifecycle: experiment tracking, model packaging, registry, and deployment. It is widely adopted by data science teams who want a vendor-neutral foundation they can self-host and integrate with any cloud.
- Datadog – For teams running inference workloads in production, Datadog monitors GPU utilization, inference API latency, pipeline service health, and cost per prediction, bridging the gap between the ML team’s model concerns and the infrastructure team’s operational concerns.
- Prometheus + Grafana – For model serving on Kubernetes (via TensorFlow Serving, Triton, or vLLM), Prometheus scrapes throughput, latency, and queue depth metrics while Grafana dashboards give the team real-time visibility into serving health during traffic spikes.
- SageMaker Model Monitor – For teams deployed on AWS SageMaker, Model Monitor is the native solution for detecting data quality issues and model drift in production. It compares incoming inference data against a baseline and alerts when distributions shift, which is the signal that your model needs retraining.
- Kubeflow – Kubeflow is the Kubernetes-native ML pipeline orchestration platform. It provides built-in monitoring for pipeline runs, component-level execution logs, and resource consumption, essential for teams running large-scale training workflows on Kubernetes clusters.
LLM and GenAI Development (GPT, Claude, Llama, RAG Pipelines)
This is the frontier of continuous monitoring devops tools. The LLM observability space is evolving rapidly, and the honest takeaway from our internal AI engineering discussions is the same one we hear repeated across every team: “Observability for LLMs is still messy and everyone is stitching tools together.” But the stack is solidifying fast, and the tools below represent what our LLM engineering teams are converging on.
- Langfuse – Langfuse is an open-source LLM observability platform that traces every prompt, completion, and chain step with cost, latency, and token usage attached. It is self-hostable, OpenTelemetry-friendly, and the top choice for engineering teams that want full data ownership over their LLM telemetry.
- LangSmith – If your team is building with LangChain or LangGraph, LangSmith is the best-in-class debugging and evaluation platform. It visualizes agent graphs step by step, lets you replay failed runs, and supports human-in-the-loop annotation for building evaluation datasets.
- Helicone – Helicone is a lightweight open-source proxy that sits between your application and any LLM provider (OpenAI, Anthropic, Azure, etc.). Every API call is logged automatically with cost, latency, prompt, and response, with zero code changes required beyond swapping the base URL.
- Arize AI – Arize AI provides scalable span-level LLM tracing and real-time evaluation dashboards designed for larger organizations. It supports multi-model environments and is particularly strong on evaluation pipelines, letting teams run automated quality checks against production traffic.
- Datadog LLM Observability – Datadog extended its APM platform to cover LLM applications, monitoring token usage, estimated cost, hallucination rates, and API latency across multiple providers. For teams already in the Datadog ecosystem, it is the easiest way to add LLM visibility without introducing another tool.
- Weights & Biases Weave – W&B Weave traces and debugs LLM applications and RAG workflows with the same experiment tracking philosophy W&B brought to ML training. It is particularly useful for teams iterating on prompt engineering and RAG retrieval quality, where you need to compare hundreds of runs systematically.
- OpenLLMetry + OpenTelemetry – OpenLLMetry is an open-source project that adds LLM-specific semantic conventions on top of OpenTelemetry, letting teams instrument their LLM applications in a vendor-neutral way and route telemetry to any backend, whether that is Grafana, Datadog, Langfuse, or elsewhere.
Agentic AI Development (LangGraph, AutoGen, CrewAI, Custom Agents)
Agent monitoring is fundamentally about debugging reasoning chains and multi-step tool-call workflows, not just measuring latency. Monitoring here means understanding why an agent took a wrong turn, which tool call returned unexpected output, and where in a 20-step chain the plan fell apart.
- AgentOps – AgentOps is purpose-built for AI agent observability. It records full session replays of agent runs, logs every tool call with its inputs and outputs, tracks per-step token costs, and surfaces agent success and failure rates in a dashboard designed specifically for agentic workflows rather than traditional APM.
- Langfuse – Langfuse supports multi-step agent workflow tracing with span-level logging for each tool invocation. Every LLM call, retrieval step, and tool execution appears as a nested span in a timeline, making it possible to see exactly where in a long chain the agent’s behavior deviated from the expected path.
- Arize Phoenix – Arize Phoenix is an open-source observability platform that natively supports CHAIN, TOOL, and AGENT span types defined by the OpenTelemetry GenAI specification. It is one of the few tools that can trace a full multi-agent system where one agent hands off to another.
- LangSmith – For teams building on LangGraph, LangSmith provides deep agent graph visualization and debugging. You can inspect every node in the graph, replay specific steps, and compare the behavior of different agent configurations against the same input.
- OpenTelemetry GenAI – OpenTelemetry GenAI is the emerging open standard for framework-agnostic agent telemetry. It defines semantic conventions for LLM calls, tool use, and agent reasoning steps so that instrumentation written once works across LangChain, AutoGen, CrewAI, and custom frameworks alike.
- Maxim AI – Maxim AI provides end-to-end agent evaluation and monitoring with LLM-as-a-judge scoring built in. Rather than only tracking whether an agent completed a task, Maxim evaluates the quality of the agent’s reasoning and output at each step, giving teams a quality signal alongside the standard latency and cost metrics.
Struggling to track issues before they impact users?
Discover powerful DevOps monitoring tools built for web, mobile, LLMs, and Salesforce ecosystems.
Continuous Monitoring Tools in DevOps: The Full Picture
The phrase continuous monitoring tools devOps teams rely on has expanded well beyond simple uptime monitors. Today it spans the full software delivery lifecycle. Here is how the key tools map to each phase:
- Code and Build: Sentry (error tracking in CI), GitHub Actions with health checks
- Deploy: Datadog Deployment Tracking, New Relic Change Tracking, Gearset (Salesforce)
- Run: Infra: Prometheus, Grafana, Zabbix, Datadog, Nagios
- Run: Apps: New Relic APM, Datadog APM, Dynatrace, Elastic APM
- Run: Logs: ELK Stack, Grafana Loki, Splunk, Graylog
- Run: Traces: Jaeger, Tempo, OpenTelemetry, Datadog APM
- Run: LLM/AI: Langfuse, LangSmith, AgentOps, Arize, Helicone
- Incident Response: PagerDuty, OpsGenie, Splunk On-Call
The thread running through all of it is OpenTelemetry, the open-source instrumentation standard that lets you collect metrics, logs, and traces once and route them to any backend without vendor lock-in. Our engineering teams increasingly treat it as a mandatory starting point for any new service.
Key Trends in DevOps Monitoring (2026–2027)
Across internal engineering discussions, architecture reviews, and tooling evaluations, our teams agree on these patterns shaping the monitoring landscape right now:
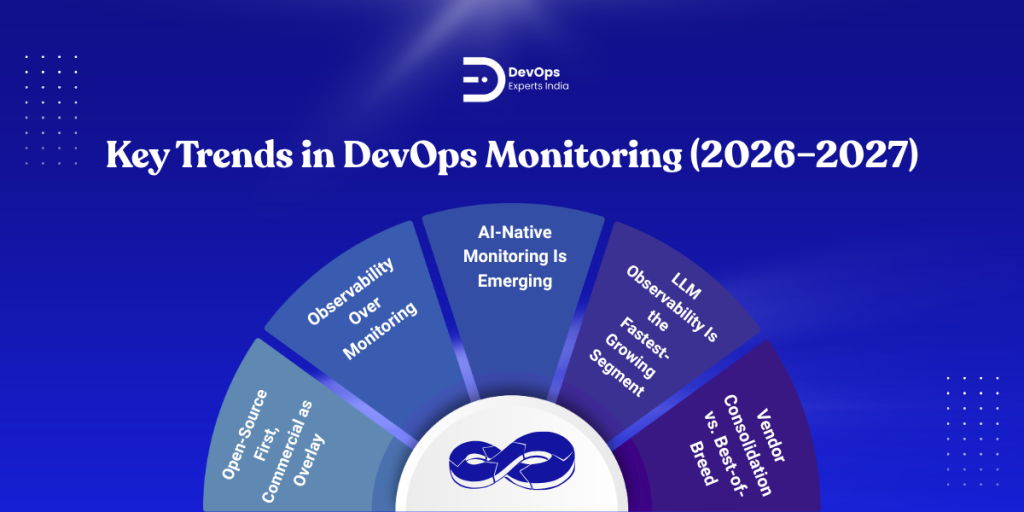
- Open-Source First, Commercial as Overlay: The dominant pattern across our teams: start with Prometheus + Grafana + Open Telemetry, then add Datadog or New Relic where you need managed SaaS convenience. Teams that skip the open-source foundation often find themselves locked in and overpaying.
- Observability Over Monitoring: “Monitoring” tells you something is wrong. “Observability” tells you why. The shift from dashboards to structured telemetry (Open Telemetry traces with rich metadata) is now mainstream in our highest-performing engineering teams.
- AI-Native Monitoring Is Emerging: Dynatrace and Datadog both use machine learning to detect anomalies and suggest root causes. In the LLM space, tools like Langfuse and Arize Phoenix add evaluation layers, automatically scoring whether an AI response met quality expectations.
- LLM Observability Is the Fastest-Growing Segment: Every new AI product team now needs to monitor token costs, prompt performance, and hallucination rates alongside traditional APM metrics. This is the highest-growth area in the DeVops monitoring tools ecosystem in 2025 and 2026.
- Vendor Consolidation vs. Best-of-Breed: Larger enterprise teams lean toward Datadog or Dynatrace for everything in one place. Smaller and cost-conscious teams build best-of-breed stacks: Prometheus + Loki + Tempo + Grafana + Sentry +Langfuse. Both are valid approaches, and the right choice depends on team size and budget.
How to Choose the Right DevOps Monitoring Tool
With so many options, the decision framework matters more than the tool list. Here are the questions to ask:
What are you building?
Match domain-specific tools to your stack (mobile, LLM, IoT, etc.)
What is your budget?
Open-source stacks are free but require engineering time; SaaS tools cost money but save setup overhead.
What is your scale?
Prometheus handles millions of time-series; for massive log volume, consider Victoria Metrics or Grafana Cloud.
Do you need real-time alerting?
PagerDuty or OpsGenie should be in your stack regardless of other choices.
Are you building AI or LLM products?
Add a dedicated LLM observability layer, because traditional APM tools do not capture prompt quality, token costs, or hallucination rates.
How mature is your team?
Beginners should start with Grafana Cloud (managed) or New Relic Free Tier; advanced teams should build the open-source stack for full control.
FAQs
What are the monitoring tools in DevOps?
The most widely used monitoring tools in DevOps span multiple categories. For metrics and dashboards, Prometheus and Grafana are the open-source standard. For full-stack SaaS monitoring, Datadog and New Relic are the leading commercial options. For log management, the ELK Stack (Elasticsearch, Logstash, Kibana) or Grafana Loki are common choices. For distributed tracing, Jaeger and Open Telemetry are the go-to tools. Domain-specific tools include Firebase Crashlytics and Sentry for mobile apps, Langfuse and LangSmith for LLM/GenAI development, and AgentOps and Arize Phoenix for agentic AI systems.
What is continuous monitoring in DevOps?
Continuous monitoring in DevOps is the automated, uninterrupted practice of tracking system health, application performance, and security posture across the entire software delivery lifecycle, from code commit through to production. Unlike periodic or manual checks, continuous monitoring fires alerts the moment anomalies appear, integrates with CI/CD pipelines so every deployment is immediately tracked, and provides real-time dashboards accessible to the entire team. It enables teams to detect and resolve issues faster, often before end users are even aware of a problem.
What is monitoring in DevOps?
Monitoring in DevOps is the practice of collecting, analyzing, and alerting on data from your software infrastructure and applications to ensure they are healthy, performant, and reliable. It covers three pillars: metrics (quantitative measurements like CPU usage, API latency, and error rates), logs (timestamped records of events from applications and systems), and traces (end-to-end records of how a request travels through a distributed system). Monitoring in DevOps is what gives teams the visibility to operate systems confidently in production.
What are monitoring tools in DevOps?
Monitoring tools in DevOps are software platforms and agents that collect, store, visualize, and alert on operational data from your applications and infrastructure. They range from open-source tools like Prometheus (metrics), Grafana (dashboards), Jaeger (distributed tracing), and the ELK Stack (log analytics), to commercial platforms like Datadog, New Relic, Dynatrace, and Splunk. Newer categories include LLM observability tools like Langfuse and Helicone for AI/GenAI applications, and agent-specific tools like AgentOps and Arize Phoenix for monitoring agentic AI workflows.
What is DevOps monitoring?
DevOps monitoring is the discipline of continuously observing the health, performance, and reliability of software systems built and operated under a DevOps model. It brings together metrics, logs, traces, and events into a unified observability framework that gives development, operations, and platform engineering teams a shared view of production. DevOps monitoring differs from traditional IT monitoring in that it is deeply integrated with CI/CD pipelines, designed to support fast deployment cadences, and increasingly extended to cover AI/LLM systems, mobile applications, and IoT device fleets alongside traditional web and cloud infrastructure.

